
Visualize payment time, space, and lifecycle behavior#
Goal. Explore a bounded, deterministic payment world through computed tables and plots.
Audience. Data scientists and ML engineers learning FraudTwin’s core simulation workflows.
Prerequisites. Python 3.12+, FraudTwin, and Polars. Optional plotting cells can install notebook packages.
Source size. 1,000 logical payments; outputs are reproducible and temporary.
Offline path. Analysis runs without Kafka, databases, or cloud services.
Optional notebook packages#
Run this only for richer plots or t-SNE output.
!pip install matplotlib scikit-learn
1. Generate the source world#
from pathlib import Path

import polars as pl

import fraudtwin
from fraudtwin.config import SimulationRunConfig, load_config

root = next(
    path
    for path in (Path.cwd(), *Path.cwd().parents)
    if (path / "configs" / "minimal.yaml").is_file()
)
base = load_config(root / "configs" / "minimal.yaml")
values = base.model_dump(mode="python")
values["payments"]["daily_target"] = 100
values["simulation"]["duration_days"] = 10
values["population"].update(
    {
        "customers": 100,
        "accounts": 200,
        "cards": 200,
        "merchants": 30,
        "devices": 200,
        "pix_keys": 100,
    }
)
values["behavior"]["amount_max"] = 100
values["simulation"]["seed"] = 2501
config = SimulationRunConfig.model_validate(values)
data = fraudtwin.generate(config)
print({"run_id": data.run_id, "payments": len(data.behavior.payments)})
assert len(data.behavior.payments) >= 1_000
{'run_id': 'RUN-f61020a6db72d42d', 'payments': 1000}
2. Analysis step#
payments = pl.DataFrame(
    [
        {
            "payment_id": p.payment_id,
            "rail": p.payment_rail,
            "amount": p.amount,
            "status": p.current_status,
        }
        for p in data.behavior.payments
    ]
)
display(payments.head())
assert payments.height == 1_000
shape: (5, 4)
| payment_id | rail | amount | status |
|---|---|---|---|
| str | str | f64 | str |
| "PAY-00000001" | "ACCOUNT_TRANSFER" | 99.14 | "COMPLETED" |
| "PAY-00000002" | "CARD" | 60.55 | "SETTLED" |
| "PAY-00000003" | "ACCOUNT_TRANSFER" | 51.47 | "COMPLETED" |
| "PAY-00000004" | "ACCOUNT_TRANSFER" | 1.92 | "COMPLETED" |
| "PAY-00000005" | "PIX" | 10.19 | "RECEIVED" |
3. Analysis step#
rail_counts = payments.group_by("rail").len().sort("len", descending=True)
rail_counts
shape: (3, 2)
| rail | len |
|---|---|
| str | u32 |
| "CARD" | 587 |
| "PIX" | 228 |
| "ACCOUNT_TRANSFER" | 185 |
4. Analysis step#
amount_summary = payments.select(
    [
        pl.col("amount").min().alias("min"),
        pl.col("amount").median().alias("median"),
        pl.col("amount").max().alias("max"),
    ]
)
amount_summary
shape: (1, 3)
| min | median | max |
|---|---|---|
| f64 | f64 | f64 |
| 1.24 | 28.54 | 100.0 |
5. Analysis step#
event_frame = pl.DataFrame(
    [
        {"event_type": e.event_type, "event_time": e.event_time, "payment_id": e.payment_id}
        for e in data.behavior.payment_events
    ]
)
event_frame.group_by("event_type").len().sort("len", descending=True).head(10)
shape: (10, 2)
| event_type | len |
|---|---|
| str | u32 |
| "CARD_PAYMENT_INITIATED" | 587 |
| "CARD_AUTHORIZATION_REQUESTED" | 587 |
| "CARD_AUTHORIZED" | 532 |
| "CARD_CAPTURED" | 519 |
| "CARD_SETTLED" | 508 |
| "CARD_CLEARED" | 508 |
| "PIX_VALIDATED" | 228 |
| "PIX_INITIATED" | 228 |
| "PIX_SETTLED" | 219 |
| "PIX_RECEIVED" | 219 |
6. Analysis step#
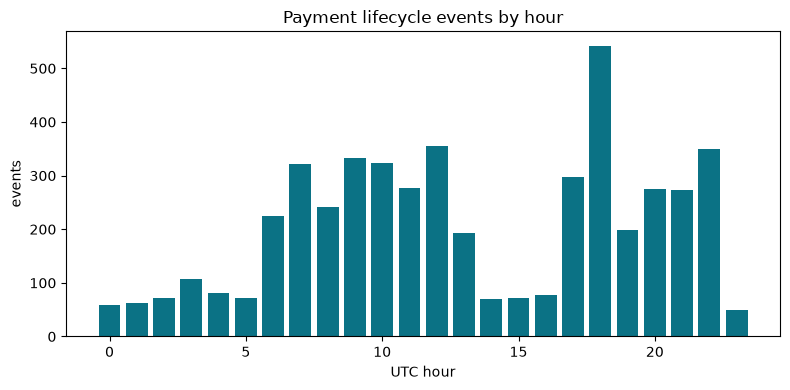
hourly = (
    event_frame.with_columns(pl.col("event_time").dt.hour().alias("hour"))
    .group_by("hour")
    .len()
    .sort("hour")
)
display(hourly)
shape: (24, 2)
| hour | len |
|---|---|
| i8 | u32 |
| 0 | 58 |
| 1 | 63 |
| 2 | 71 |
| 3 | 108 |
| 4 | 81 |
| … | … |
| 19 | 199 |
| 20 | 275 |
| 21 | 274 |
| 22 | 350 |
| 23 | 49 |
7. Analysis step#
lifecycle = event_frame.group_by(["payment_id", "event_type"]).len()
print({"payments_with_events": lifecycle.select("payment_id").n_unique()})
{'payments_with_events': 1000}
8. Analysis step#
try:
    import matplotlib.pyplot as plt

    fig, axis = plt.subplots(figsize=(8, 4))
    axis.bar(hourly["hour"].to_list(), hourly["len"].to_list(), color="#0b7285")
    axis.set(title="Payment lifecycle events by hour", xlabel="UTC hour", ylabel="events")
    fig.tight_layout()
    plt.show()
    plt.close(fig)
except ImportError:
    print("Install matplotlib to render the lifecycle chart.")
9. Analysis step#
fingerprint = fraudtwin.aggregate_fingerprint([dict(row) for row in payments.to_dicts()])
print({"payment_fingerprint": f"{fingerprint}"})
assert isinstance(fingerprint, str) and fingerprint
{'payment_fingerprint': 'cbbbc87581d82883ee5a4a957f7c037eff24f8fe08607e1295db754d788036f2'}
assert hourly.height > 0
assert fingerprint
print("Lifecycle analysis contract passed")