
Compare Fraud Scenarios, Difficulty, and Camouflage#
This tutorial builds a small scenario benchmark. It compares a baseline world with two resolved difficulty levels and a camouflage run, then visualizes what changed.
These measurements describe generated fraud evidence—not detector quality. Labels are intentionally unresolved, so model metrics belong in the ML evaluation tutorials.
Notebook package#
This tutorial assumes Matplotlib is installed in the notebook kernel. If needed, run %pip install matplotlib once and rerun the notebook.
1. Define a fair comparison#
All runs use the same seed, population, payment volume, fraud workflow, and time window. Only the benchmark control changes: no benchmark for the baseline, resolved difficulty 7 or 10, or M13 camouflage.
import copy
import json
from pathlib import Path
from tempfile import TemporaryDirectory

try:
    import matplotlib.pyplot as plt
except ModuleNotFoundError:
    plt = None
import polars as pl

import fraudtwin
from fraudtwin.config import SimulationRunConfig, load_config

root = next(
    path
    for path in (Path.cwd(), *Path.cwd().parents)
    if (path / "configs" / "minimal.yaml").is_file()
)
base = load_config(root / "configs" / "minimal.yaml")
base_values = base.model_dump(mode="python")
base_values["payments"]["daily_target"] = 100
base_values["simulation"]["duration_days"] = 10
base_values["simulation"]["seed"] = 2501
base_values["population"].update(
    {
        "customers": 100,
        "accounts": 200,
        "cards": 200,
        "merchants": 30,
        "devices": 200,
        "pix_keys": 100,
    }
)
base_values["behavior"]["amount_max"] = 100
base_values["fraud"].update({"enabled": True, "target_rate": 0.05})
base_values["fraud_workflow"]["enabled"] = True


def build_config(control: str | None) -> SimulationRunConfig:
    values = copy.deepcopy(base_values)
    if control in {"Difficulty 7", "Difficulty 10"}:
        values["benchmark"] = {"difficulty": int(control.rsplit(" ", 1)[1])}
    elif control == "Camouflage":
        values["stress"] = {
            "camouflage": 0.80,
            "feature_camouflage": 0.85,
            "relation_camouflage": 0.75,
            "cohort": {
                "strategy": "same_rail_and_profile",
                "profile_dimensions": [
                    "spending_level",
                    "country",
                    "merchant_category",
                    "typical_payment_hour",
                    "trusted_device",
                ],
                "minimum_size": 3,
                "fallback": "same_rail",
            },
        }
    return SimulationRunConfig.model_validate(values)


configs = {
    label: build_config(control)
    for label, control in [
        ("Baseline", None),
        ("Difficulty 7", "Difficulty 7"),
        ("Difficulty 10", "Difficulty 10"),
        ("Camouflage", "Camouflage"),
    ]
}
2. Generate the comparable runs#
Each run is generated independently from the same base configuration. The manifest records the resolved difficulty or camouflage settings, which we inspect later instead of printing the full manifest.
runs = {label: fraudtwin.generate(config) for label, config in configs.items()}
summary_rows = []
scenario_rows = []
amount_rows = []
for label, result in runs.items():
    records = result.behavior.fraud_records
    known_truth = [record.fraud_truth for record in records if record.fraud_truth is not None]
    difficulty = result.manifest.difficulty or {}
    camouflage = result.manifest.camouflage or {}
    resolved_global = camouflage.get("resolved_global", {})
    summary_rows.append(
        {
            "Scenario": label,
            "Run ID": result.run_id,
            "Payments": len(result.behavior.payments),
            "Fraud records": len(records),
            "True fraud records": sum(value is True for value in known_truth),
            "Truth share": sum(value is True for value in known_truth) / len(known_truth)
            if known_truth
            else None,
            "Difficulty": difficulty.get("requested_difficulty"),
            "Camouflage": resolved_global.get("camouflage"),
        }
    )
    for record in records:
        scenario_rows.append(
            {"Scenario": label, "Fraud type": record.scenario_type, "Truth": record.fraud_truth}
        )
        amount_rows.append(
            {"Scenario": label, "Amount": record.amount, "Truth": record.fraud_truth}
        )
benchmark_summary = pl.DataFrame(summary_rows)
scenario_frame = pl.DataFrame(scenario_rows)
amount_frame = pl.DataFrame(amount_rows)
scenario_names = sorted(scenario_frame["Fraud type"].unique().to_list())
assert scenario_names and scenario_frame.height > 0
3. Plot the benchmark summary#
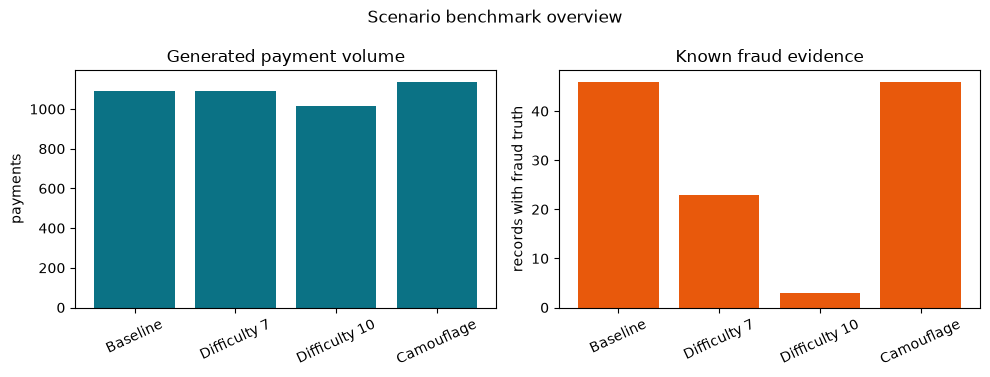
The first figure shows scale and known fraud evidence. A lower truth share is not automatically better or worse; it means the generated fraud-record set contains more unresolved or hard-negative cases.
if plt is None:
    print("Install matplotlib to render the scenario plots.")
else:
    labels = benchmark_summary["Scenario"].to_list()
    fig, axes = plt.subplots(1, 2, figsize=(10, 3.8))
    axes[0].bar(labels, benchmark_summary["Payments"].to_list(), color="#0b7285")
    axes[0].set(title="Generated payment volume", ylabel="payments")
    axes[1].bar(labels, benchmark_summary["True fraud records"].to_list(), color="#e8590c")
    axes[1].set(title="Known fraud evidence", ylabel="records with fraud truth")
    for axis in axes:
        axis.tick_params(axis="x", rotation=25)
    fig.suptitle("Scenario benchmark overview")
    fig.tight_layout()
    plt.show()
    plt.close(fig)
4. Plot the scenario mix#
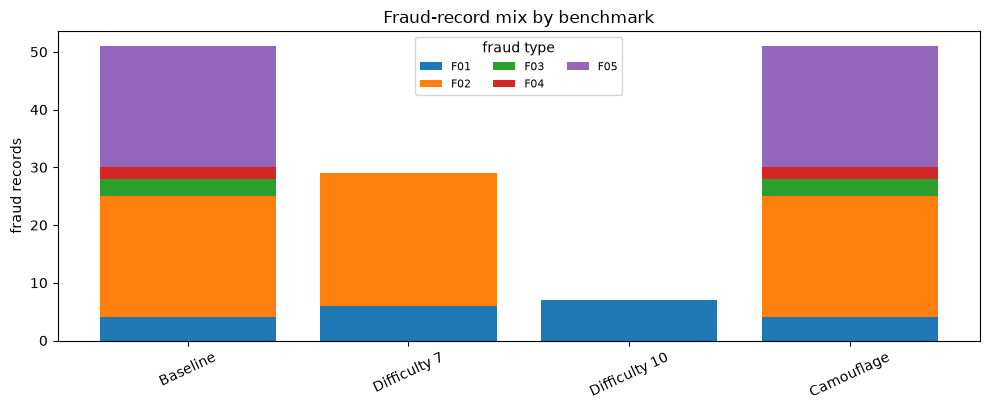
This stacked chart checks that the difficulty controls do not silently replace the fraud objectives with a different scenario population.
if plt is None:
    print("Install matplotlib to render the fraud-record mix plot.")
else:
    fig, axis = plt.subplots(figsize=(10, 4.2))
    bottom = [0] * len(labels)
    for fraud_type in scenario_names:
        values = [
            int(
                scenario_frame.filter(
                    (pl.col("Scenario") == label) & (pl.col("Fraud type") == fraud_type)
                ).height
            )
            for label in labels
        ]
        axis.bar(labels, values, bottom=bottom, label=fraud_type)
        bottom = [current + value for current, value in zip(bottom, values, strict=False)]
    axis.set(title="Fraud-record mix by benchmark", ylabel="fraud records")
    axis.tick_params(axis="x", rotation=25)
    axis.legend(title="fraud type", ncol=3, fontsize=8)
    fig.tight_layout()
    plt.show()
    plt.close(fig)
5. Plot the fraud-amount distributions#
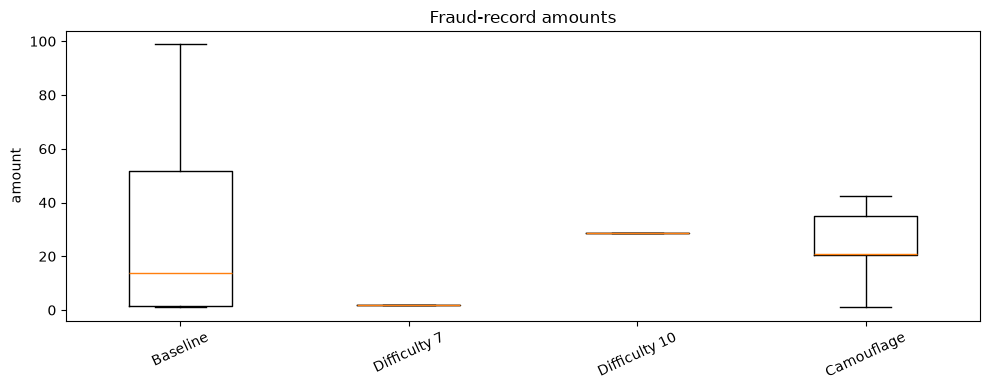
This is a descriptive check of the generated evidence. It is not a classifier score and should not replace a matured-label evaluation.
if plt is None:
    print("Install matplotlib to render the fraud-record amount plot.")
else:
    amount_values = [
        amount_frame.filter(pl.col("Scenario") == label)["Amount"].drop_nulls().to_list()
        for label in labels
    ]
    fig, axis = plt.subplots(figsize=(10, 4))
    axis.boxplot(amount_values, tick_labels=labels, showfliers=False)
    axis.set(title="Fraud-record amounts", ylabel="amount")
    axis.tick_params(axis="x", rotation=25)
    fig.tight_layout()
    plt.show()
    plt.close(fig)
6. Inspect compact benchmark tables#
The plots show the pattern; these tables preserve the exact run identities and measurements without dumping entire manifests.
benchmark_summary.with_columns(pl.col("Truth share").round(3))
| Scenario | Run ID | Payments | Fraud records | True fraud records | Truth share | Difficulty | Camouflage |
|---|---|---|---|---|---|---|---|
| str | str | i64 | i64 | i64 | f64 | i64 | f64 |
| "Baseline" | "RUN-f2bd687be19810c7" | 1092 | 51 | 46 | 0.902 | null | null |
| "Difficulty 7" | "RUN-26360e676647d13f" | 1092 | 29 | 23 | 0.793 | 7 | null |
| "Difficulty 10" | "RUN-28f74200f6f7e3bf" | 1015 | 7 | 3 | 0.429 | 10 | null |
| "Camouflage" | "RUN-e48a8943d4228423" | 1138 | 51 | 46 | 0.902 | null | 0.8 |
scenario_frame.group_by(["Scenario", "Fraud type"]).len(name="Records").sort(
    ["Scenario", "Fraud type"]
)
| Scenario | Fraud type | Records |
|---|---|---|
| str | str | u32 |
| "Baseline" | "F01" | 4 |
| "Baseline" | "F02" | 21 |
| "Baseline" | "F03" | 3 |
| "Baseline" | "F04" | 2 |
| "Baseline" | "F05" | 21 |
| … | … | … |
| "Camouflage" | "F04" | 2 |
| "Camouflage" | "F05" | 21 |
| "Difficulty 10" | "F01" | 7 |
| "Difficulty 7" | "F01" | 6 |
| "Difficulty 7" | "F02" | 23 |
amount_frame.group_by("Scenario").agg(
    [
        pl.col("Amount").quantile(0.25).alias("Q1"),
        pl.col("Amount").median().alias("Median"),
        pl.col("Amount").quantile(0.75).alias("Q3"),
    ]
).sort("Scenario")
| Scenario | Q1 | Median | Q3 |
|---|---|---|---|
| str | f64 | f64 | f64 |
| "Baseline" | 1.7 | 13.83 | 52.16 |
| "Camouflage" | 20.63 | 20.72 | 34.96 |
| "Difficulty 10" | 28.58 | 28.58 | 28.58 |
| "Difficulty 7" | 2.0 | 2.0 | 2.0 |
7. Verify the controls that actually resolved#
Difficulty levels are resolved by FraudTwin. Showing the resolved values prevents a benchmark from claiming that two runs differ when the generator received the same effective controls. Camouflage is reported separately because it is a different stress mechanism.
control_rows = []
for label in ("Difficulty 7", "Difficulty 10"):
    resolved = runs[label].manifest.difficulty["resolved_controls"]
    for name, value in resolved.items():
        control_rows.append({"Scenario": label, "Control": name, "Resolved value": value})
control_table = pl.DataFrame(control_rows)
control_table
| Scenario | Control | Resolved value |
|---|---|---|
| str | str | f64 |
| "Difficulty 7" | "fraud_legitimate_overlap" | 0.666667 |
| "Difficulty 7" | "behavioral_deviation" | 0.666667 |
| "Difficulty 7" | "scenario_subtlety" | 0.666667 |
| "Difficulty 7" | "noise_hard_negatives" | 0.666667 |
| "Difficulty 7" | "prevalence" | 0.666667 |
| … | … | … |
| "Difficulty 10" | "scenario_subtlety" | 1.0 |
| "Difficulty 10" | "noise_hard_negatives" | 1.0 |
| "Difficulty 10" | "prevalence" | 1.0 |
| "Difficulty 10" | "temporal_irregularity" | 1.0 |
| "Difficulty 10" | "graph_structural_subtlety" | 1.0 |
camouflage_table = benchmark_summary.filter(pl.col("Scenario") == "Camouflage").select(
    ["Scenario", "Camouflage"]
)
camouflage_table
| Scenario | Camouflage |
|---|---|
| str | f64 |
| "Camouflage" | 0.8 |
8. Save a small reproducibility report#
The report contains the compact benchmark summary and scenario counts. The temporary directory keeps this tutorial self-contained; a production run would write the artifact to its run directory.
scenario_counts = scenario_frame.group_by(["Scenario", "Fraud type"]).len(name="Records").to_dicts()
report_payload = {
    "benchmark_summary": benchmark_summary.to_dicts(),
    "scenario_counts": scenario_counts,
}
with TemporaryDirectory(prefix="fraudtwin-scenario-benchmark-") as tmp:
    report_path = Path(tmp) / "benchmark-summary.json"
    report_path.write_text(json.dumps(report_payload, default=str, indent=2), encoding="utf-8")
    artifact_summary = pl.DataFrame(
        [
            {
                "Artifact": report_path.name,
                "Bytes": report_path.stat().st_size,
                "Runs": len(runs),
                "Scenario types": len(scenario_names),
            }
        ]
    )
    assert report_path.stat().st_size > 100
artifact_summary
| Artifact | Bytes | Runs | Scenario types |
|---|---|---|---|
| str | i64 | i64 | i64 |
| "benchmark-summary.json" | 2279 | 4 | 5 |
9. Interpret the result#
This benchmark answers: did the generator create comparable worlds, resolve the requested controls, preserve the scenario mix, and produce explainable amount distributions? It does not answer whether a fraud model catches the cases. For that, wait for label maturity and evaluate one fixed detector protocol across these same runs.
assert set(runs) == {"Baseline", "Difficulty 7", "Difficulty 10", "Camouflage"}
assert all(len(result.behavior.payments) >= 1_000 for result in runs.values())
assert runs["Difficulty 7"].manifest.difficulty["requested_difficulty"] == 7
assert runs["Difficulty 10"].manifest.difficulty["requested_difficulty"] == 10
assert (
    runs["Difficulty 7"].manifest.difficulty["resolved_controls"]
    != runs["Difficulty 10"].manifest.difficulty["resolved_controls"]
)
assert runs["Camouflage"].manifest.camouflage["resolved_global"]["camouflage"] == 0.8
assert scenario_frame.height > 0 and amount_frame.height > 0