
Explore ML-ready distributions, correlation, and embeddings#
Goal. Explore a bounded, deterministic payment world through computed tables and plots, including a clearly marked simulator-truth view when operational labels are not mature.
Audience. Data scientists and ML engineers exploring FraudTwin’s generated features and model inputs.
Prerequisites. Python 3.12+, FraudTwin, and Polars. Optional plotting cells can install notebook packages.
Source size. 1,000 logical payments with a small fraud scenario enabled for the embedding demonstration; outputs are reproducible and temporary.
Offline path. Analysis runs without Kafka, databases, or cloud services.
Optional notebook packages#
Run this only for richer plots or t-SNE output.
!pip install matplotlib scikit-learn
1. Generate the source world#
import json
from pathlib import Path
from tempfile import TemporaryDirectory

import polars as pl

import fraudtwin
from fraudtwin.config import SimulationRunConfig, load_config

root = next(
    path
    for path in (Path.cwd(), *Path.cwd().parents)
    if (path / "configs" / "minimal.yaml").is_file()
)
base = load_config(root / "configs" / "minimal.yaml")
values = base.model_dump(mode="python")
values["payments"]["daily_target"] = 100
values["simulation"]["duration_days"] = 10
values["population"].update(
    {
        "customers": 100,
        "accounts": 200,
        "cards": 200,
        "merchants": 30,
        "devices": 200,
        "pix_keys": 100,
    }
)
values["behavior"]["amount_max"] = 100
values["simulation"]["seed"] = 2501
values["fraud"]["enabled"] = True
values["fraud"]["target_rate"] = 0.05
config = SimulationRunConfig.model_validate(values)
data = fraudtwin.generate(config)
simulator_truth = {
    record.payment_id: int(record.fraud_truth) for record in data.behavior.fraud_records
}
simulator_fraud_count = sum(simulator_truth.values())
print("Source run")
print(f"  run_id: {data.run_id}")
print(f"  payments: {len(data.behavior.payments):,}")
print(f"  simulator fraud truth: {simulator_fraud_count:,}")
assert len(data.behavior.payments) >= 1_000
Source run
  run_id: RUN-f2bd687be19810c7
  payments: 1,092
  simulator fraud truth: 46
2. Analysis step#
frame = data.require_dataset().frame
print({"rows": frame.height, "columns": frame.width})
assert frame.height > 0
{'rows': 1081, 'columns': 53}
3. Analysis step#
numeric = [
    name
    for name, dtype in frame.schema.items()
    if dtype in (pl.Float64, pl.Float32, pl.Int64, pl.Int32)
]
print({"numeric_features": numeric[:12]})
{'numeric_features': ['amount', 'transaction_count_1m', 'transaction_count_5m', 'transaction_count_1h', 'transaction_count_24h', 'transaction_count_7d', 'transaction_count_30d', 'transaction_amount_1h', 'transaction_amount_24h', 'transaction_amount_7d', 'avg_transaction_amount_30d', 'max_transaction_amount_7d']}
4. Analysis step#
missingness = frame.select([pl.col(name).is_null().mean().alias(name) for name in numeric[:8]])
missingness
| amount | transaction_count_1m | transaction_count_5m | transaction_count_1h | transaction_count_24h | transaction_count_7d | transaction_count_30d | transaction_amount_1h |
|---|---|---|---|---|---|---|---|
| f64 | f64 | f64 | f64 | f64 | f64 | f64 | f64 |
| 0.0 | 0.0 | 0.0 | 0.0 | 0.0 | 0.0 | 0.0 | 0.0 |
5. Analysis step#
label_balance = (
    frame.group_by("label").len().sort("len", descending=True)
    if "label" in frame.columns
    else pl.DataFrame()
)
display(label_balance)
| label | len |
|---|---|
| str | u32 |
| null | 1081 |
6. Analysis step#
feature_summary = frame.select([pl.col(name).mean().alias(f"{name}_mean") for name in numeric[:6]])
feature_summary
| amount_mean | transaction_count_1m_mean | transaction_count_5m_mean | transaction_count_1h_mean | transaction_count_24h_mean | transaction_count_7d_mean |
|---|---|---|---|---|---|
| f64 | f64 | f64 | f64 | f64 | f64 |
| 39.853737 | 0.712303 | 0.718779 | 0.79741 | 1.882516 | 6.315449 |
7. Analysis step#
correlation = frame.select(numeric[:6]).corr() if len(numeric) >= 2 else pl.DataFrame()
display(correlation)
| amount | transaction_count_1m | transaction_count_5m | transaction_count_1h | transaction_count_24h | transaction_count_7d |
|---|---|---|---|---|---|
| f64 | f64 | f64 | f64 | f64 | f64 |
| 1.0 | -0.099808 | -0.099875 | -0.10012 | -0.094979 | -0.061106 |
| -0.099808 | 1.0 | 0.999633 | 0.995041 | 0.828738 | 0.316516 |
| -0.099875 | 0.999633 | 1.0 | 0.995481 | 0.828993 | 0.316903 |
| -0.10012 | 0.995041 | 0.995481 | 1.0 | 0.834916 | 0.321428 |
| -0.094979 | 0.828738 | 0.828993 | 0.834916 | 1.0 | 0.458411 |
| -0.061106 | 0.316516 | 0.316903 | 0.321428 | 0.458411 | 1.0 |
8. Analysis step#
time_splits = (
    frame.group_by("split").len().sort("split") if "split" in frame.columns else pl.DataFrame()
)
display(time_splits)
| split | len |
|---|---|
| str | u32 |
| "test" | 148 |
| "train" | 794 |
| "validation" | 139 |
9. Analysis step#
embedding_input = frame.select(numeric[:6]).with_columns(
    [pl.col(name).cast(pl.Float64).fill_null(0.0).alias(name) for name in numeric[:6]]
)
try:
    from sklearn.manifold import TSNE
    from sklearn.preprocessing import StandardScaler

    values = StandardScaler().fit_transform(embedding_input.to_numpy())
    sample_n = min(240, len(values))
    perplexity = min(30, max(5, sample_n // 10))
    embedding = TSNE(
        n_components=2,
        random_state=42,
        init="pca",
        learning_rate="auto",
        perplexity=perplexity,
        max_iter=350,
    ).fit_transform(values[:sample_n])
    print({"embedding_rows": sample_n, "method": "sklearn.TSNE", "shape": embedding.shape})
    assert embedding.shape == (sample_n, 2)
except ImportError:
    embedding = embedding_input.to_numpy()[: min(240, embedding_input.height)]
    print({"embedding_rows": len(embedding), "method": "scaled-feature fallback"})
{'embedding_rows': 240, 'method': 'sklearn.TSNE', 'shape': (240, 2)}
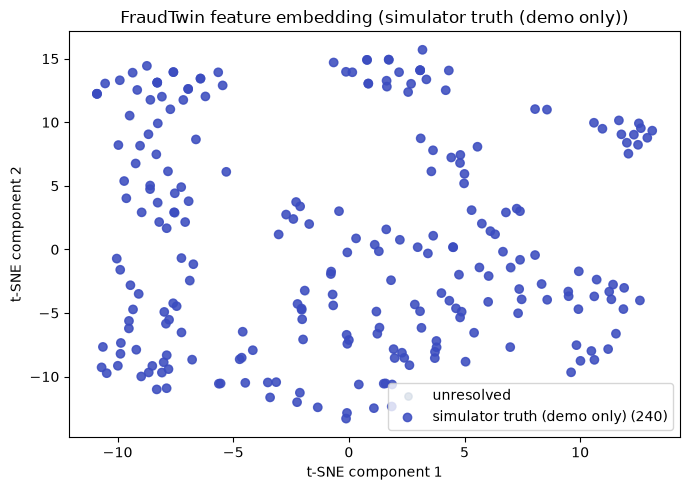
Optional plot: inspect the embedding#
Run this cell after the install cell to inspect the embedding. Mature operational labels are preferred; this bounded demo falls back to explicitly marked simulator truth because its generated labels are unresolved.
import matplotlib.pyplot as plt

operational_values = (
    frame.get_column("label").to_list()[: len(embedding)]
    if "label" in frame.columns
    else [None] * len(embedding)
)
if any(value is not None for value in operational_values):
    label_values = operational_values
    label_source = "mature operational labels"
elif simulator_fraud_count:
    label_values = [
        simulator_truth.get(payment_id, 0)
        for payment_id in frame["payment_id"].to_list()[: len(embedding)]
    ]
    label_source = "simulator truth (demo only)"
else:
    label_values = [None] * len(embedding)
    label_source = "labels unavailable"
known_positions = [index for index, value in enumerate(label_values) if value is not None]
fig, axis = plt.subplots(figsize=(7, 5))
axis.scatter(
    embedding[:, 0],
    embedding[:, 1],
    color="#cbd5e1",
    alpha=0.55,
    s=28,
    label="unresolved" if known_positions else "points",
)
if known_positions:
    label_codes = [
        1 if str(label_values[index]).lower() in {"1", "true", "fraud"} else 0
        for index in known_positions
    ]
    axis.scatter(
        embedding[known_positions, 0],
        embedding[known_positions, 1],
        c=label_codes,
        cmap="coolwarm",
        alpha=0.85,
        s=36,
        label=f"{label_source} ({len(known_positions):,})",
    )
    if len(set(label_codes)) > 1:
        fig.colorbar(axis.collections[-1], ax=axis, label="label code")
title = (
    f"FraudTwin feature embedding ({label_source})"
    if known_positions
    else "FraudTwin feature embedding (labels unavailable)"
)
axis.set(title=title, xlabel="t-SNE component 1", ylabel="t-SNE component 2")
axis.legend()
fig.tight_layout()
plt.show()
plt.close(fig)
10. Analysis step#
with TemporaryDirectory(prefix="fraudtwin-viz-27-") as tmp:
    report = Path(tmp) / "feature-summary.json"
    report.write_text(
        json.dumps({"numeric": numeric, "rows": frame.height}, default=str), encoding="utf-8"
    )
    print({"artifact": str(report), "bytes": report.stat().st_size})
    assert report.stat().st_size < 20_000
{'artifact': '/tmp/fraudtwin-viz-27-evt917tv/feature-summary.json', 'bytes': 731}