
Investigate fraud with temporal graph exports#
Goal. Build observable and oracle graph views, inspect a compact fraud-oriented query result, export Neo4j-compatible files, and optionally run a live Cypher smoke check.
Prerequisites. Base FraudTwin install. Optional extras and Docker commands are clearly marked.
Produces. A view comparison, relationship summaries, one diagnostic plot, and a dependency-free Neo4j export.
Source size. The graph fixture generates fewer than 1,000 payments and includes graph campaigns for observable/oracle comparison.
Offline path. All marked offline cells run without Docker or network services. Service cells are optional and explicitly marked in notebook metadata.
Important. Observable data is safe for detector inputs; oracle campaign membership is for investigation and evaluation only.
!pip install neo4j matplotlib
Requirement already satisfied: neo4j in /home/emc/Projects/test/.venv/lib/python3.14/site-packages (6.3.1)
Requirement already satisfied: matplotlib in /home/emc/Projects/test/.venv/lib/python3.14/site-packages (3.11.2)
Requirement already satisfied: pytz in /home/emc/Projects/test/.venv/lib/python3.14/site-packages (from neo4j) (2026.3.post1)
Requirement already satisfied: contourpy>=1.0.1 in /home/emc/Projects/test/.venv/lib/python3.14/site-packages (from matplotlib) (1.4.0)
Requirement already satisfied: cycler>=0.10 in /home/emc/Projects/test/.venv/lib/python3.14/site-packages (from matplotlib) (0.12.1)
Requirement already satisfied: fonttools>=4.28.2 in /home/emc/Projects/test/.venv/lib/python3.14/site-packages (from matplotlib) (4.66.0)
Requirement already satisfied: kiwisolver>=1.3.1 in /home/emc/Projects/test/.venv/lib/python3.14/site-packages (from matplotlib) (1.5.1)
Requirement already satisfied: numpy>=1.25 in /home/emc/Projects/test/.venv/lib/python3.14/site-packages (from matplotlib) (2.5.3)
Requirement already satisfied: packaging>=20.0 in /home/emc/Projects/test/.venv/lib/python3.14/site-packages (from matplotlib) (26.3)
Requirement already satisfied: pillow>=9 in /home/emc/Projects/test/.venv/lib/python3.14/site-packages (from matplotlib) (12.3.0)
Requirement already satisfied: pyparsing>=3 in /home/emc/Projects/test/.venv/lib/python3.14/site-packages (from matplotlib) (3.3.3)
Requirement already satisfied: python-dateutil>=2.7 in /home/emc/Projects/test/.venv/lib/python3.14/site-packages (from matplotlib) (2.9.0.post0)
Requirement already satisfied: six>=1.5 in /home/emc/Projects/test/.venv/lib/python3.14/site-packages (from python-dateutil>=2.7->matplotlib) (1.17.0)

[notice] A new release of pip is available: 26.1 -> 26.2.1
[notice] To update, run: pip install --upgrade pip
Optional Neo4j setup#
The first cell installs the Neo4j driver. Start Neo4j only for live Cypher checks; graph export and investigation remain offline.
docker run --name fraudtwin-neo4j --detach --rm --publish 7474:7474 --publish 7687:7687 --env NEO4J_AUTH=neo4j/password neo4j:5
Use FRAUDTWIN_NEO4J_URI, FRAUDTWIN_NEO4J_USER, and FRAUDTWIN_NEO4J_PASSWORD for other endpoints. Stop with docker stop fraudtwin-neo4j; unavailable Bolt connections use the offline fallback.
Set up a deterministic source run
import json
from pathlib import Path

import polars as pl

from fraudtwin.config import load_config
from fraudtwin.generation import generate

root = next(
    (p for p in (Path.cwd(), *Path.cwd().parents) if (p / "configs" / "minimal.yaml").exists()),
    Path.cwd(),
)
config = load_config(root / "configs" / "benchmarks" / "graph-v2.yaml")
data = generate(config, write=False)
run_id = data.run_id
payments = pl.DataFrame([item.model_dump(mode="json") for item in data.behavior.payments])
print("Source run")
print(f"  run_id: {run_id}")
print(f"  payments: {len(payments):,}")
print(f"  payment events: {len(data.behavior.payment_events):,}")
print(f"  graph campaigns: {len(data.behavior.graph_campaigns):,}")
Source run
  run_id: RUN-d4fe1230e312957d
  payments: 757
  payment events: 2,642
  graph campaigns: 13
Build observable and oracle views
The observable view contains relationships available to a detector. The oracle view adds campaign membership and investigation-only truth. Keeping both views side by side makes that boundary explicit.
from fraudtwin.graph import build_graph, validate_graph

graph = build_graph(config, data.entities, data.behavior, data.manifest, view="observable")
oracle_graph = build_graph(
    config,
    data.entities,
    data.behavior,
    data.manifest,
    view="oracle",
    memberships=data.behavior.graph_memberships,
)
validate_graph(graph)
validate_graph(oracle_graph)
view_summary = pl.DataFrame(
    [
        {
            "view": name,
            "nodes": item.node_frame.height,
            "edges": item.edge_frame.height,
            "patterns": item.pattern_frame.height,
            "campaigns": item.campaign_frame.height,
            "memberships": item.membership_frame.height,
            "fingerprint": f"{item.output_fingerprint[:12]}...",
        }
        for name, item in (("observable", graph), ("oracle", oracle_graph))
    ]
)
display(view_summary)
| view | nodes | edges | patterns | campaigns | memberships | fingerprint |
|---|---|---|---|---|---|---|
| str | i64 | i64 | i64 | i64 | i64 | str |
| "observable" | 417 | 4191 | 899 | 0 | 0 | "db71520b71c0..." |
| "oracle" | 443 | 4317 | 912 | 13 | 126 | "879b638b4400..." |
Run compact graph queries offline
This Polars query is the offline equivalent of a Cypher traversal from accounts to merchants. It lets the tutorial remain useful without requiring a running Neo4j server.
edge_counts = (
    graph.edge_frame.group_by("edge_type")
    .len()
    .rename({"len": "edges"})
    .sort("edges", descending=True)
)
top_accounts = (
    graph.edge_frame.filter(pl.col("edge_type") == "PAID")
    .group_by("src_id")
    .len()
    .rename({"src_id": "account_id", "len": "merchant_payments"})
    .sort("merchant_payments", descending=True)
)
print("Relationship types")
display(edge_counts.head(8))
print("Accounts with the most merchant payments")
display(top_accounts.head(8))
Relationship types
| edge_type | edges |
|---|---|
| str | u32 |
| "USES" | 960 |
| "SHARES_DEVICE" | 680 |
| "TRANSFERRED_TO" | 625 |
| "PAID" | 526 |
| "PURCHASED_FROM" | 526 |
| "RECEIVED_FROM" | 488 |
| "OWNS" | 240 |
| "HELD_AT" | 120 |
Accounts with the most merchant payments
| account_id | merchant_payments |
|---|---|
| str | u32 |
| "ACC-000078" | 36 |
| "ACC-000117" | 26 |
| "ACC-000092" | 24 |
| "ACC-000077" | 20 |
| "ACC-000088" | 20 |
| "ACC-000057" | 20 |
| "ACC-000075" | 18 |
| "ACC-000114" | 16 |
Inspect detected graph patterns
Patterns are observable structural findings. Campaign membership is intentionally absent from the observable view and remains available only in the oracle view.
pattern_summary = (
    graph.pattern_frame.group_by("pattern_type")
    .len()
    .rename({"len": "patterns"})
    .sort("patterns", descending=True)
)
print(f"Observable patterns: {graph.pattern_frame.height:,}")
display(pattern_summary.head(8))
Observable patterns: 899
| pattern_type | patterns |
|---|---|
| str | u32 |
| "SHARED_DEVICE_INFRASTRUCTURE" | 680 |
| "CYCLIC_RING" | 165 |
| "MULE_NETWORK" | 49 |
| "SHARED_IP_INFRASTRUCTURE" | 3 |
| "FAN_IN" | 1 |
| "FAN_OUT" | 1 |
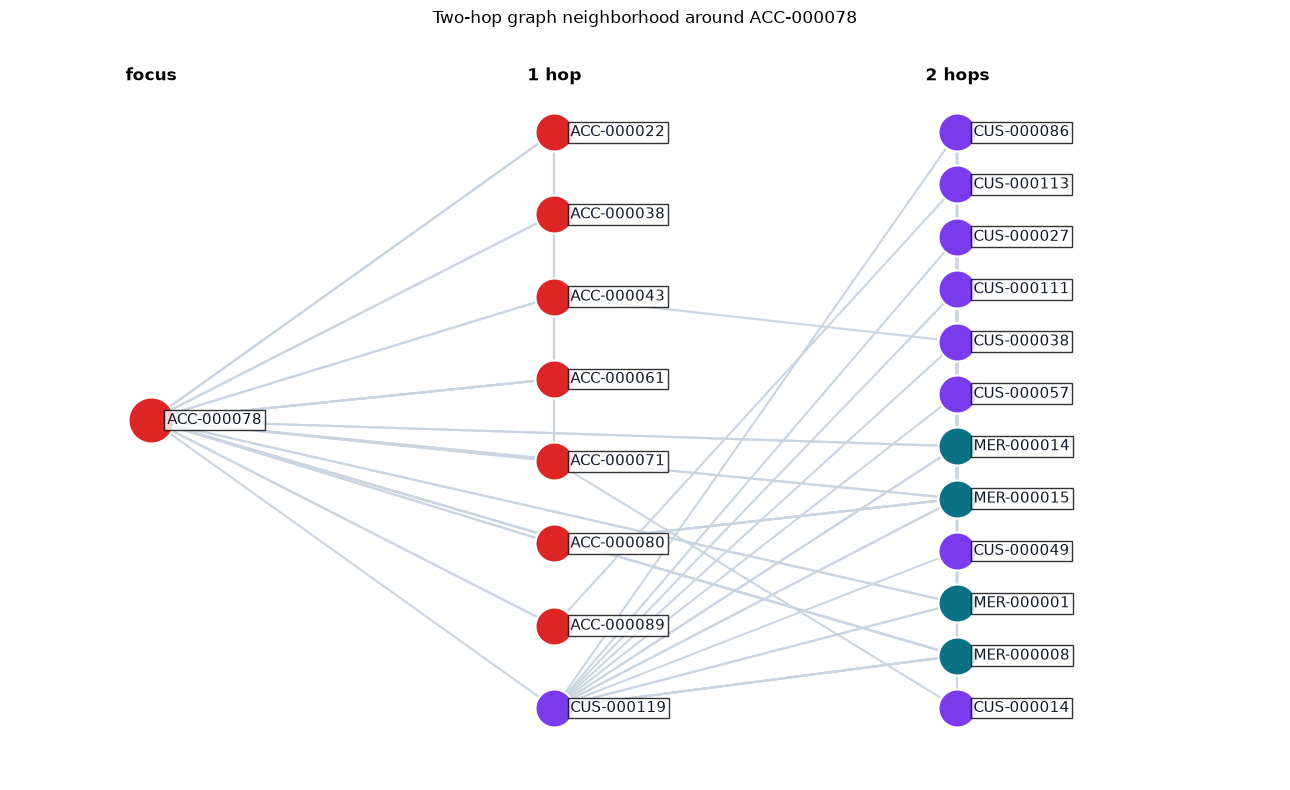
Plot a local graph neighborhood
The table above answers an aggregate question. This figure shows a readable two-hop neighborhood: the focus account, its direct neighbors, and neighbors-of-neighbors.
try:
    import matplotlib.pyplot as plt

    focus_id = top_accounts["account_id"][0]
    all_edges = graph.edge_frame.select(["src_id", "dst_id", "edge_type"]).to_dicts()
    adjacency = {}
    for edge in all_edges:
        adjacency.setdefault(edge["src_id"], set()).add(edge["dst_id"])
        adjacency.setdefault(edge["dst_id"], set()).add(edge["src_id"])
    first_hop = sorted(adjacency.get(focus_id, ()))[:8]
    second_candidates = {
        node_id
        for first_node in first_hop
        for node_id in adjacency.get(first_node, ())
        if node_id != focus_id and node_id not in first_hop
    }
    second_hop = sorted(
        second_candidates, key=lambda node_id: (-len(adjacency.get(node_id, ())), node_id)
    )[:12]
    visible_nodes = {focus_id, *first_hop, *second_hop}
    visible_edges = [
        edge
        for edge in all_edges
        if edge["src_id"] in visible_nodes and edge["dst_id"] in visible_nodes
    ]
    positions = {focus_id: (0.0, 0.0)}
    for y_value, node_id in enumerate(first_hop):
        positions[node_id] = (1.0, 1.0 - 2.0 * y_value / max(1, len(first_hop) - 1))
    for y_value, node_id in enumerate(second_hop):
        positions[node_id] = (2.0, 1.0 - 2.0 * y_value / max(1, len(second_hop) - 1))
    node_types = {row["node_id"]: row["node_type"] for row in graph.node_frame.to_dicts()}
    colors = {"ACCOUNT": "#dc2626", "MERCHANT": "#0b7285", "CUSTOMER": "#7c3aed"}
    fig, axis = plt.subplots(figsize=(13, 8))
    for edge in visible_edges:
        if edge["src_id"] in positions and edge["dst_id"] in positions:
            x_values = [positions[edge["src_id"]][0], positions[edge["dst_id"]][0]]
            y_values = [positions[edge["src_id"]][1], positions[edge["dst_id"]][1]]
            axis.plot(x_values, y_values, color="#cbd5e1", linewidth=1.5, zorder=1)
    for node_id, (x_value, y_value) in positions.items():
        node_type = node_types.get(node_id, "ENTITY")
        axis.scatter(
            [x_value],
            [y_value],
            s=1100 if node_id == focus_id else 750,
            color=colors.get(node_type, "#64748b"),
            edgecolor="white",
            linewidth=1.5,
            zorder=2,
        )
        axis.text(
            x_value + 0.04,
            y_value,
            node_id,
            ha="left",
            va="center",
            fontsize=11,
            color="#111827",
            bbox={"facecolor": "white", "alpha": 0.8, "pad": 2},
            zorder=3,
        )
    axis.text(0.0, 1.18, "focus", ha="center", fontsize=12, fontweight="bold")
    axis.text(1.0, 1.18, "1 hop", ha="center", fontsize=12, fontweight="bold")
    axis.text(2.0, 1.18, "2 hops", ha="center", fontsize=12, fontweight="bold")
    axis.set(
        title=f"Two-hop graph neighborhood around {focus_id}", xlim=(-0.35, 2.8), ylim=(-1.25, 1.35)
    )
    axis.axis("off")
    fig.tight_layout()
    plt.show()
    plt.close(fig)
except ImportError:
    print("Install matplotlib to render the two-hop graph neighborhood plot.")

display(top_accounts.head(8))
| account_id | merchant_payments |
|---|---|
| str | u32 |
| "ACC-000078" | 36 |
| "ACC-000117" | 26 |
| "ACC-000092" | 24 |
| "ACC-000077" | 20 |
| "ACC-000088" | 20 |
| "ACC-000057" | 20 |
| "ACC-000075" | 18 |
| "ACC-000114" | 16 |
Export dependency-free Neo4j artifacts
The export contains CSV files, constraints, and import instructions. The temporary directory keeps this tutorial reproducible without leaving generated data in the repository.
from tempfile import TemporaryDirectory

from fraudtwin.graph import write_graph

with TemporaryDirectory(prefix="fraudtwin-neo4j-") as temp_dir:
    graph_dir, export_manifest = write_graph(
        {"observable": graph, "oracle": oracle_graph},
        Path(temp_dir) / "graphs",
        source_manifest=data.manifest,
        config=config,
        formats=("parquet", "neo4j"),
    )
    neo4j_dir = graph_dir / "observable" / "neo4j"
    export_files = pl.DataFrame(
        [{"file": path.name, "bytes": path.stat().st_size} for path in sorted(neo4j_dir.iterdir())]
    )
    neo4j_export_fingerprint = export_manifest.output_fingerprint

print("Neo4j-compatible export")
print("  views: observable, oracle")
print(f"  export fingerprint: {neo4j_export_fingerprint[:12]}...")
display(export_files)
Neo4j-compatible export
  views: observable, oracle
  export fingerprint: 5a93d4db744c...
| file | bytes |
|---|---|
| str | i64 |
| "IMPORT.md" | 611 |
| "constraints.cypher" | 754 |
| "neo4j-admin-import.args" | 52 |
| "nodes.csv" | 32952 |
| "relationships.csv" | 660311 |
Verify the export and source rows
The next cells keep the inspection readable and verify that the exported graph remains tied to the generated run.
# A compact inspection is more useful than printing an entire run.
sample_columns = [
    c for c in ("payment_id", "amount", "initiated_at", "payer_account_id") if c in payments.columns
]
sample_rows = payments.select(sample_columns).head(8).to_dicts()
print(f"Sample payments ({len(sample_rows)} of {payments.height} rows):")
for row in sample_rows:
    print(
        f"  - {row.get('payment_id')}: amount={row.get('amount')}, "
        f"initiated_at={row.get('initiated_at')}, payer={row.get('payer_account_id')}"
    )
nulls = {name: count for name, count in payments.null_count().to_dicts()[0].items() if count}
print("\nData quality summary:")
print(f"  rows: {payments.height}")
print(f"  columns: {payments.width}")
if not nulls:
    print("  nulls: none")
else:
    print("  columns with nulls:")
    for name, count in sorted(nulls.items()):
        print(f"    - {name}: {count}")
Sample payments (8 of 757 rows):
  - PAY-00000001: amount=16.48, initiated_at=2026-01-03T22:42:00Z, payer=ACC-000028
  - PAY-00000002: amount=50.72, initiated_at=2026-01-02T21:42:00Z, payer=ACC-000104
  - PAY-00000003: amount=10.0, initiated_at=2026-01-01T13:14:00Z, payer=ACC-000055
  - PAY-00000004: amount=393.98, initiated_at=2026-01-06T14:22:00Z, payer=ACC-000088
  - PAY-00000005: amount=14.33, initiated_at=2026-01-05T13:22:00Z, payer=ACC-000042
  - PAY-00000006: amount=10.0, initiated_at=2026-01-05T18:51:00Z, payer=ACC-000055
  - PAY-00000007: amount=19.03, initiated_at=2026-01-07T18:14:00Z, payer=ACC-000099
  - PAY-00000008: amount=20.44, initiated_at=2026-01-05T12:47:00Z, payer=ACC-000080

Data quality summary:
  rows: 757
  columns: 15
  columns with nulls:
    - card_id: 500
    - merchant_id: 488
    - payee_account_id: 12
    - payee_pix_key_id: 620
    - payer_pix_key_id: 620
Review the run manifest
summary = {
    "run_id": run_id,
    "payments": len(data.behavior.payments),
    "payment_events": len(data.behavior.payment_events),
    "fraud_records": len(data.behavior.fraud_records),
    "observable_patterns": graph.pattern_frame.height,
    "oracle_campaigns": oracle_graph.campaign_frame.height,
    "oracle_memberships": oracle_graph.membership_frame.height,
}
assert summary["payments"] == len(payments)
assert summary["payments"] > 0
print(json.dumps(summary, indent=2, default=str))
{
  "run_id": "RUN-d4fe1230e312957d",
  "payments": 757,
  "payment_events": 2642,
  "fraud_records": 57,
  "observable_patterns": 899,
  "oracle_campaigns": 13,
  "oracle_memberships": 126
}
Run the optional live Neo4j smoke check
This cell checks connectivity and a tiny write. It does not pretend that the temporary CSV export has already been imported into the server.
import os

try:
    from neo4j import GraphDatabase

    driver = GraphDatabase.driver(
        os.getenv("FRAUDTWIN_NEO4J_URI", "bolt://localhost:7687"),
        auth=(
            os.getenv("FRAUDTWIN_NEO4J_USER", "neo4j"),
            os.getenv("FRAUDTWIN_NEO4J_PASSWORD", "password"),
        ),
        connection_timeout=3.0,
    )
    driver.verify_connectivity()
    with driver.session() as session:
        ok = session.run("RETURN 1 AS ok").single()["ok"]
        loaded = session.run(
            "MERGE (n:FraudTwinTutorial {id: $id}) RETURN count(n) AS count",
            id=run_id,
        ).single()["count"]
    print({"connected": True, "query": ok, "tutorial_nodes": loaded})
except Exception as exc:
    print({"connected": False, "offline_fallback": True, "reason": type(exc).__name__})
finally:
    if "driver" in locals():
        driver.close()
{'connected': False, 'offline_fallback': True, 'reason': 'ServiceUnavailable'}
Record the generated shape and tutorial contract#
assert graph.output_fingerprint
assert oracle_graph.output_fingerprint
assert neo4j_export_fingerprint
assert oracle_graph.campaign_frame.height > 0
print("Verified: observable and oracle views are distinct and exportable.")
Verified: observable and oracle views are distinct and exportable.
assert graph.output_fingerprint
print({"offline_fallback": True, "graph_fingerprint": f"{graph.output_fingerprint}"})
{'offline_fallback': True, 'graph_fingerprint': 'db71520b71c00732be5357a67a93a9a643a141afc5ad214e3219bf761675f5f7'}